Bring Claude Code into Visual Studio 2026 - a native diff window with accept/reject, automatic selection + compiler-diagnostics context, live debugger access, semantic code navigation + decompile (Roslyn), a test runner that catches failures under the debugger, and a stats panel. The
claudeCLI does the agent work; this extension is the IDE half of Claude Code's integration protocol.
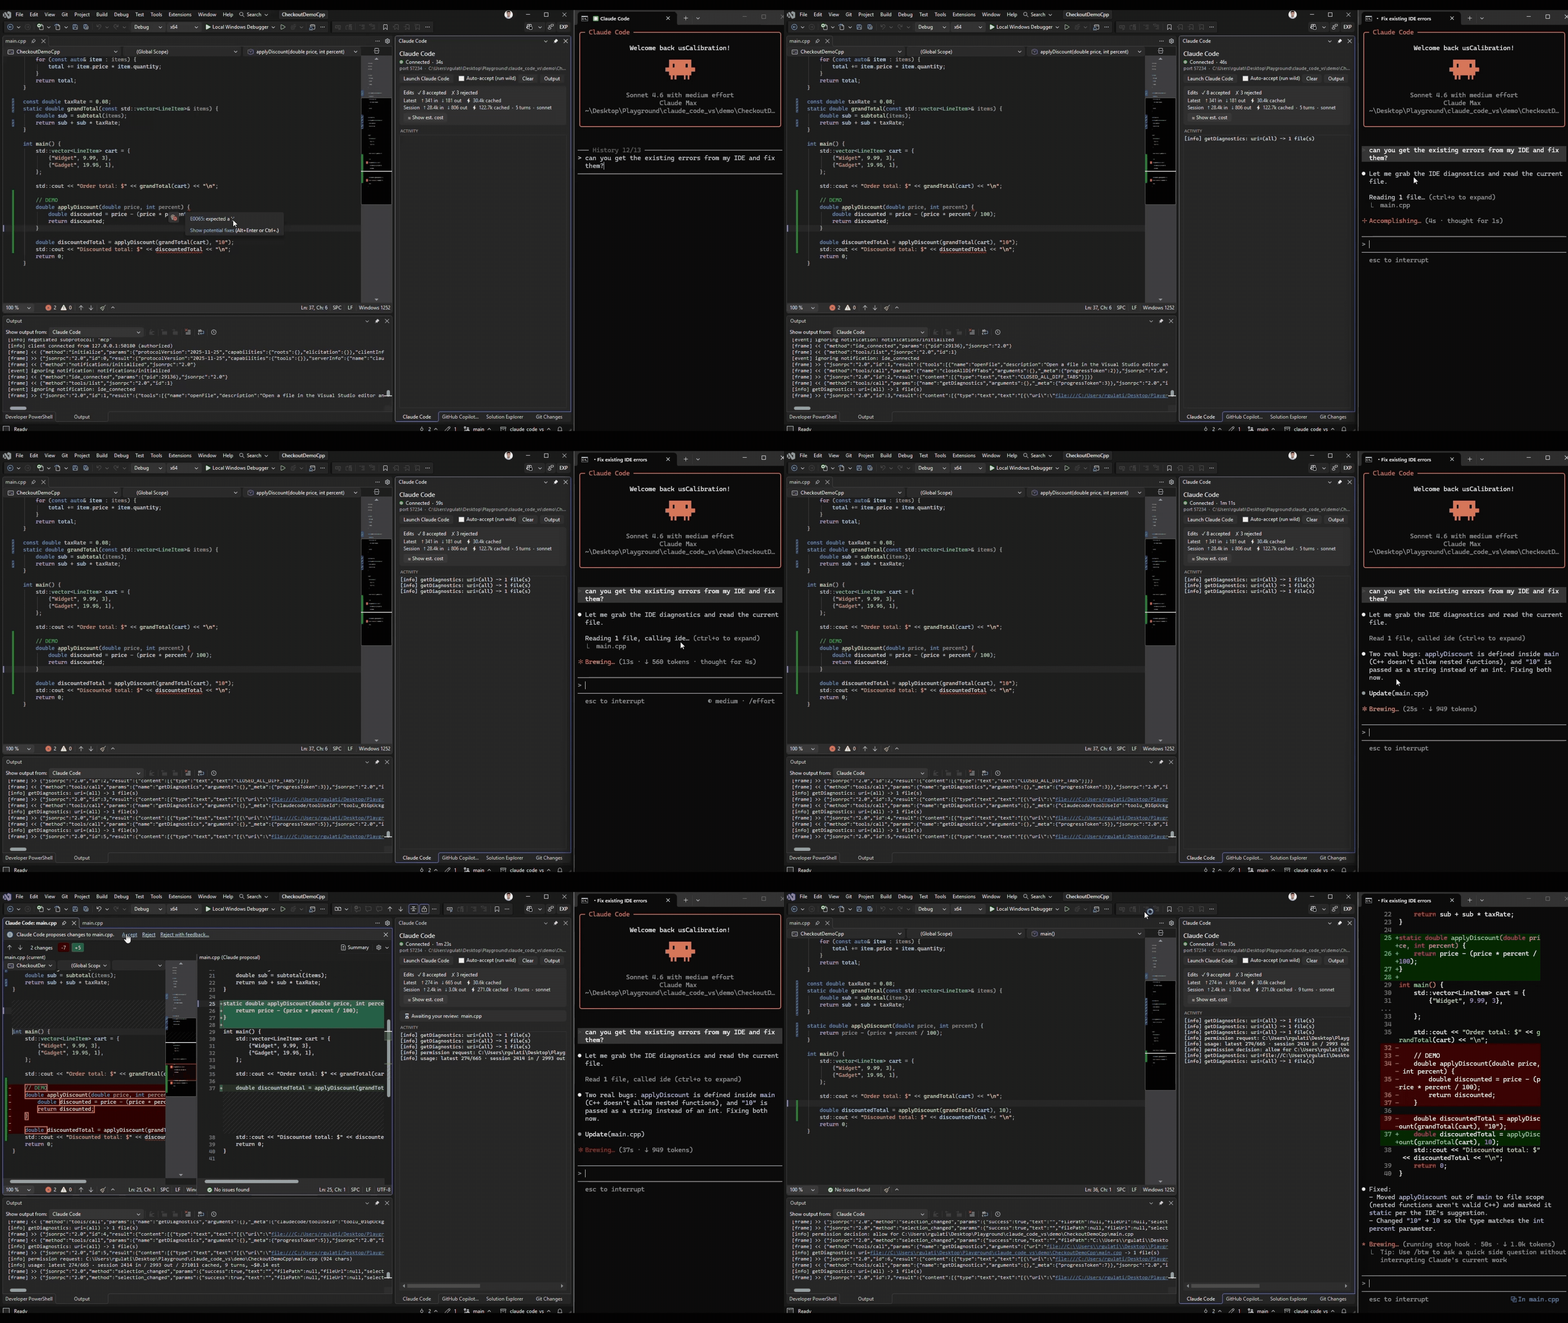
Status: community project, not affiliated with Anthropic. Visual Studio 2026 only, for now.
Claude Code has first-class IDE integration for VS Code and JetBrains, but not Visual Studio - see anthropics/claude-code#15942. This extension implements that same IDE-integration protocol natively for VS, so the CLI drives a real Visual Studio diff window and sees your selection and build errors - instead of you copy-pasting into a terminal.
- Native diff with a single accept/reject gate - Claude's edits open in Visual Studio's diff viewer, and approving there is the only step (no duplicate y/n prompt in the terminal).
- Reject with feedback - reject an edit and tell Claude what to change; it reconsiders with your note.
- Run wild (auto-accept) - a panel toggle to apply edits without opening the diff, for when you want to let it cook. Resets each session.
- Diagnostics sharing - Claude reads Visual Studio's compiler errors/warnings (C# and C++) and fixes them.
- Semantic code navigation - Claude asks Visual Studio's compiler (Roslyn) for the resolved meaning of your C# code instead of grepping text: find-all-references, go-to-definition, find-implementations, and call/type hierarchies. These are the ground-truth answers text search gets wrong - indirect and interface-dispatched references, the right overload, explicit interface implementations, transitive callers for impact analysis. No debug session needed; it works whenever a C#/VB solution is loaded. Full reference:
docs/SEMANTIC.md. - Live debugger - while you're paused at a breakpoint, Claude sees your program's runtime state (call stack, variable values, threads) and, opt-in, can drive the debugger - continue, step, set breakpoints, break at the throw site of an exception, set a data breakpoint that breaks (or traces the full change history) the moment a value changes, attach to a running app (a hosted web service or desktop app, not just F5), and pause a hung process to untangle a deadlock (following the lock-ownership chain across threads to the exact cycle) - to corner a bug instead of guessing from source. Full reference:
docs/DEBUGGER.md. - Test integration - Claude discovers, runs, and debugs your unit tests through Visual Studio's Test Explorer engine: real per-test results (outcome, message, stack), re-run just the failures, and - the headline - run a failing test under the debugger and stop at the fault, or hammer a flaky test until it fails and catch that iteration red-handed, paused inside the failure. Because it's the debugger's own session, a red test becomes a live investigation. Full reference:
docs/TESTING.md. - Selection context - Claude automatically knows the file and lines you're looking at.
- Live panel - a dockable Claude Code panel: connection status, edit decisions, and token usage + estimated cost (latest call vs cumulative session).
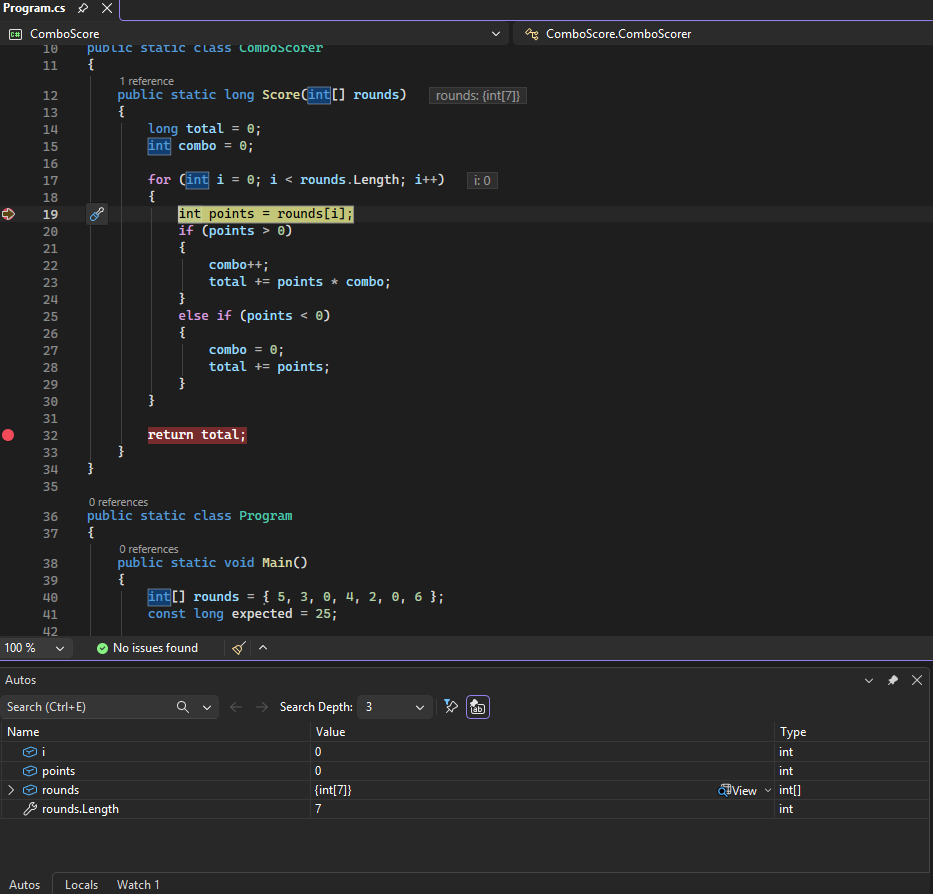
The headline of 1.2.0. Pause at a breakpoint, ask Claude what's wrong, and with driving turned on it sets breakpoints, steps through your code, and reads the runtime values to catch bugs that never show up in the output.
Here it is on a scoring function that returns the wrong total. It stopped inside the loop and stepped through the rounds, watching a counter that should reset but didn't:
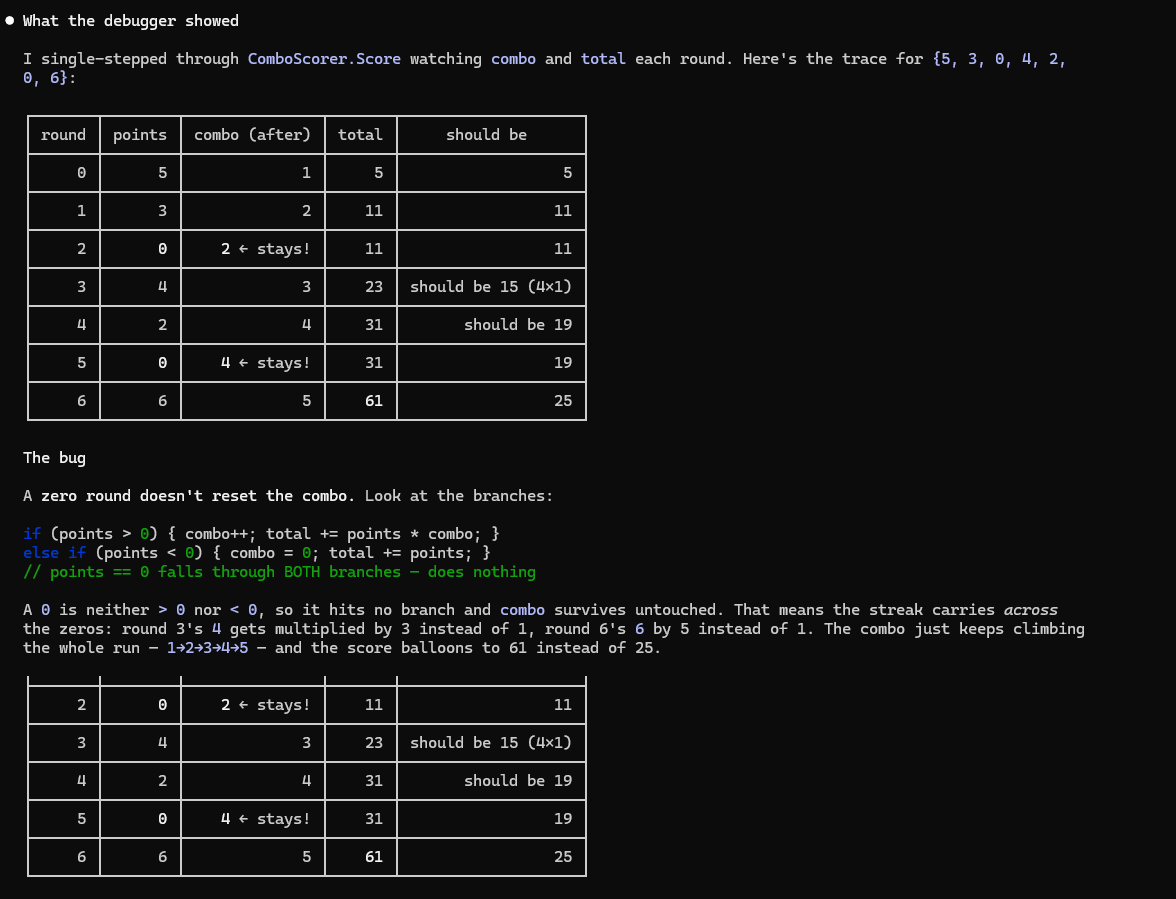
It kept a running trace of what it saw, which is how it cornered the bug:
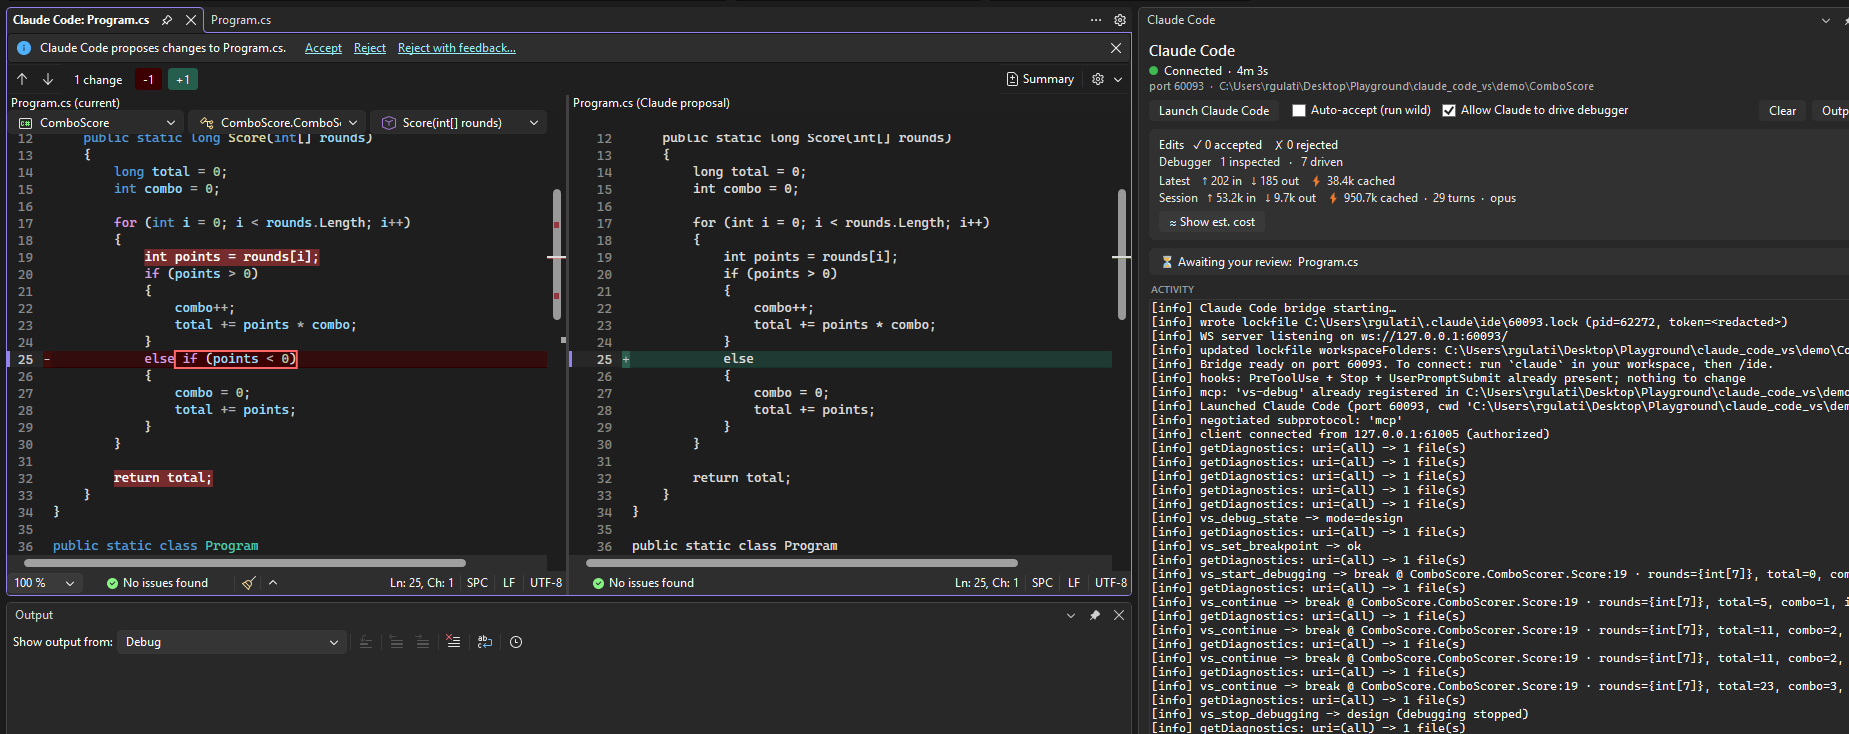
Then the fix opened in the native diff, ready to accept or reject:
Full walkthrough, the complete tool list, and the limitations are in docs/DEBUGGER.md.
It's grown well past stepping since. Claude can now attach to a running app (debug a hosted web service or an already-running desktop app, not just F5), break at the origin of an exception instead of the catch that swallows it, and pause a hung process to untangle a deadlock — reading the lock-ownership chain across threads to pin the exact cycle. There's a worked deadlock walkthrough (LockJam) in docs/DEBUGGER.md.
And newest (1.8.1): managed data breakpoints — point Claude at a field and it breaks, or traces the complete change history (every old→new value, in order), the instant the value changes — conditionally (> 700), on every change, on several values at once. That's "break when this value changes," a watch Visual Studio's own UI can't set programmatically and that has no automation API — so it's genuinely new ground for catching the write that corrupts your state.
Most assistants navigate code by grepping text — which misses indirect references and over-counts on comments, strings, and same-named symbols. This release gives Claude Visual Studio's resolved semantic model (Roslyn): the same "Find All References / Go to Definition / Find Implementations / Call Hierarchy" the IDE uses, as ground truth instead of a guess. Ask "who calls this?" or "what implements IFoo?" and it resolves through interfaces, overrides, explicit interface implementations, and overloads — the cases text search gets wrong.
The headline is vs_decompile: the one thing reading your repo fundamentally can't give you — the body of a method inside a referenced DLL. Point Claude at a framework or NuGet call (JsonConvert.SerializeObject, Enumerable.Where) and it returns the real decompiled C#, the way Go-to-Definition does. For core .NET types it even fetches the actual dotnet/runtime source via SourceLink. No more guessing what a library call does from its name.
It needs no debugger session — it works any time a C#/VB solution is open. Full tool list, the addressing model, and worked workflows are in docs/SEMANTIC.md.
dotnet test runs tests; the CLI can already do that. What it can't do is stop inside a failing test in Visual Studio's debugger, or reproduce a heisenbug on purpose and pause on it. This release gives Claude Visual Studio's own Test Explorer engine wired to the live debugger — a closed fix → verify → catch loop:
- Run — real per-test
outcome+errorMessage+ stack (data, not a text blob), one test or all, with code coverage. - Re-run failures — after a fix, re-run only the tests that failed, not the whole suite.
- Debug one — launch a single failing test under the debugger and break at the throw site with
$exceptionand locals live. - Catch red-handed — loop a flaky test under the debugger until the failing iteration halts on its own, leaving you paused inside the failure with the state that caused it — the one motion neither
dotnet testnor a re-run loop can do.
The run tools compose with the debugger tools (it's one session), so an intermittent red line goes from "can't reproduce" to "the debugger is paused on it." Full tool list and the worked flow are in docs/TESTING.md.
- Visual Studio 2026.
- The Claude Code CLI, installed and authenticated - see the Claude Code docs. This extension makes no model calls and does no agent work itself; it requires the CLI.
- Tested against
claude2.1.191.
- Marketplace: search "Claude Code for Visual Studio" in Extensions -> Manage Extensions, or install from the Visual Studio Marketplace.
- Sideload: download the
.vsixfrom Releases and double-click it.
- Open your project or solution in Visual Studio 2026.
- Open the Claude Code panel (View -> Other Windows -> Claude Code) and click Launch Claude Code (also available on the Tools menu).
- A terminal opens running
claude, already connected to the IDE (no/ideneeded). The panel pill turns green - Connected. - Ask Claude to make a change. Its edit opens as a diff - click Accept, Reject, or Reject with feedback….
Diagnostics need a loaded project (not a loose file in Open-Folder mode) for the compiler to analyze it.
To let Claude debug: set a breakpoint, tick Allow Claude to drive debugger in the panel, start debugging, then ask it to investigate. Reading runtime state works without the toggle; the toggle only gates driving execution. See
docs/DEBUGGER.md.
This is a protocol bridge, not a re-implementation of the agent. On launch the extension:
- Starts a localhost WebSocket server and writes a lockfile at
~/.claude/ide/<port>.lock. - Launches
claudewithENABLE_IDE_INTEGRATIONand the bridge port, so it auto-connects and speaks MCP / JSON-RPC over the socket. - Implements the IDE tools the CLI drives -
openDiff,openFile,getDiagnostics, selection updates, and diff-tab lifecycle.
To make the VS diff the single approval gate, the extension installs a small PreToolUse hook into your workspace's .claude/settings.json that routes proposed edits through the diff. The CLI does all agent work; the extension never makes model calls.
For debugger access, it adds a UserPromptSubmit hook (injects live break state when you're paused) and a second MCP server, vs-debug, reached through a tiny stdio shim auto-registered in your workspace .mcp.json. Reading runtime state is always allowed; driving execution is opt-in behind a panel toggle. Details: docs/DEBUGGER.md.
The same vs-debug server also carries the test-runner tools (discover / run / re-run failures / debug / flaky-hunt) — they're co-located with the debugger on purpose, so a failing or intermittent test can be caught red-handed under it. Details: docs/TESTING.md.
For semantic navigation, it adds a third MCP server, vs-semantic (the same shim, a different route), exposing Roslyn code-navigation tools backed by the live VisualStudioWorkspace. All read-only, no debug session required. Details: docs/SEMANTIC.md.
- The bridge binds to 127.0.0.1 only and validates an auth token (from the lockfile) on every connection. The token is never logged.
- The extension makes no network calls and no LLM calls of its own. All AI work is the
claudeCLI, under your own authentication. - On Launch, it writes these into your workspace's
.claude/folder and merges hook entries into.claude/settings.json(preserving existing content):vs-permission-hook.ps1- routes Edit/Write/MultiEdit edits through the VS diff.vs-usage-hook.ps1- reports the transcript path so the panel can show token stats.vs-debug-context-hook.ps1- injects live break state into your prompt while you're paused (aUserPromptSubmithook).vs-mcp-shim.ps1- a stdio bridge for thevs-debugandvs-semanticMCP servers, which it registers in your workspace.mcp.json.
- Token cost is an estimate (hardcoded per-tier prices), shown only when you click Show est. cost.
- Visual Studio 2026 only for now (a VS 2022 backfill is planned if there's demand).
- The IDE-integration protocol is undocumented and version-fragile - a
claudeupdate could change it. Known-good: 2.1.191. - Diagnostics need a loaded project (the Error List / Roslyn won't analyze loose files).
- Semantic navigation is C#/VB and needs a loaded project - it reads the Roslyn workspace, so it sees the solution open in VS (not the CLI's working directory if they differ), and doesn't cover C++ navigation or loose files.
- Debugger features target managed (.NET) code. Reading runtime state is always on; driving execution is opt-in. Native/C++ runtime inspection isn't covered.
- Test integration is managed (.NET) test projects and needs a loaded solution. Coverage works; profiling is deferred, and the debug/flaky-catch tools are opt-in behind the debugger-drive toggle. See
docs/TESTING.md. - Token stats refresh on edits (the reliable hook trigger), so a chat-only turn may not update them immediately.
- Cost figures are estimates, not billing.
- Panel says "Waiting for CLI": click Launch Claude Code, or run
/idein aclaudeterminal and pick Visual Studio. - New files land in the wrong folder: launch from the extension (it pins the working directory to your workspace), or run
claudefrom inside the repo. - getDiagnostics returns nothing: open the code as a project and confirm the error appears in the Error List.
- Filing a bug: include the Output -> Claude Code pane contents and your
claude --version.
Requires Visual Studio 2026 with the Visual Studio extension development workload.
msbuild src/ClaudeCodeVS/ClaudeCodeVS.csproj /t:Rebuild /p:Configuration=ReleasePress F5 (or launch devenv /rootsuffix Exp) to debug in the experimental instance. Architecture and contributor guidance live in CLAUDE.md. Future work lives in ROADMAP.md.
Issues and PRs welcome. The protocol contract is undocumented and has regressed before - if you bump the claude CLI, please run the spike smoke test (spike/) and note the version.
MIT © 2026 Rishi Gulati. Not affiliated with Anthropic. "Claude" and "Claude Code" are trademarks of Anthropic, used here only to describe interoperability.