This GUI is a configuration-driven market scanner and renderer. You declare what to fetch, compose indicators & strategies, and the system executes + renders incrementally.
The UI is divided into four logical regions:
[ API Selection ]   [ Fetch Config ]   [ Run ]
[ Indicators ]      [ Strategies ]     [ Charts ]
This section defines where tickers come from and how many are processed.
| Field | Meaning |
|---|---|
api (QKApi) |
Data provider (yfinance, upstox, dhan) |
exchange |
Exchange namespace (e.g. NSE) |
start_index |
Starting index into ticker list |
end_index |
Ending index (exclusive) |
enable_filter |
Enable signal-based filtering |
filter_last_n |
Lookback window (last N candles) |
Tickers are loaded from your YAML source once, then sliced:
tickers[start_index : end_index]
Examples:
0 → 10→ first 10 tickers10 → 20→ next batch- Enables batch scanning without restarting the app
When enable_filter is checked:
-
For each ticker:
- Look at last N candles
- If any strategy emits BUY or SELL → chart is rendered
- If only HOLD or no signals → ticker is skipped
This:
- avoids rendering noise
- conserves memory
- scales to large ticker sets
Controls how market data is fetched.
| Field | Meaning |
|---|---|
mode |
historical or intraday |
interval |
Candle interval (days / minutes) |
intraday_interval |
Required only for intraday |
from_date |
Start date (YYYY-MM-DD) |
to_date |
End date |
unit |
Time unit (days, etc.) |
- Dates are validated but not auto-corrected
- Changing fetch config invalidates all downstream computation
- GUI does not cache results — every run is explicit
Indicators are pure feature generators.
- Select an indicator from Indicator Config
- Fill in parameters
- Click Add
- Repeat to add multiple indicators
- Multiple instances allowed
- Same indicator + same params → deduplicated internally
- Indicators do not generate signals
- Indicators are computed once per run
Strategies convert indicators → signals.
- Select a strategy
- Configure parameters
- Click Add
- Multiple strategies can coexist
- Each strategy instance gets a unique signal column
- BUY / SELL / HOLD values are written into the DataFrame
- Strategies declare which indicators they need
- Strategy execution happens after all indicators
When you press RUN PIPELINE:
UI State
  ↓
Ticker Resolution (range-based)
  ↓
For each ticker:
  → Fetch Data
  → Run Indicators
  → Run Strategies
  → Apply Signal Filter (optional)
  → Append Chart
- Execution runs in a background thread
- UI remains responsive
- Charts appear incrementally
- Failed tickers do not block others
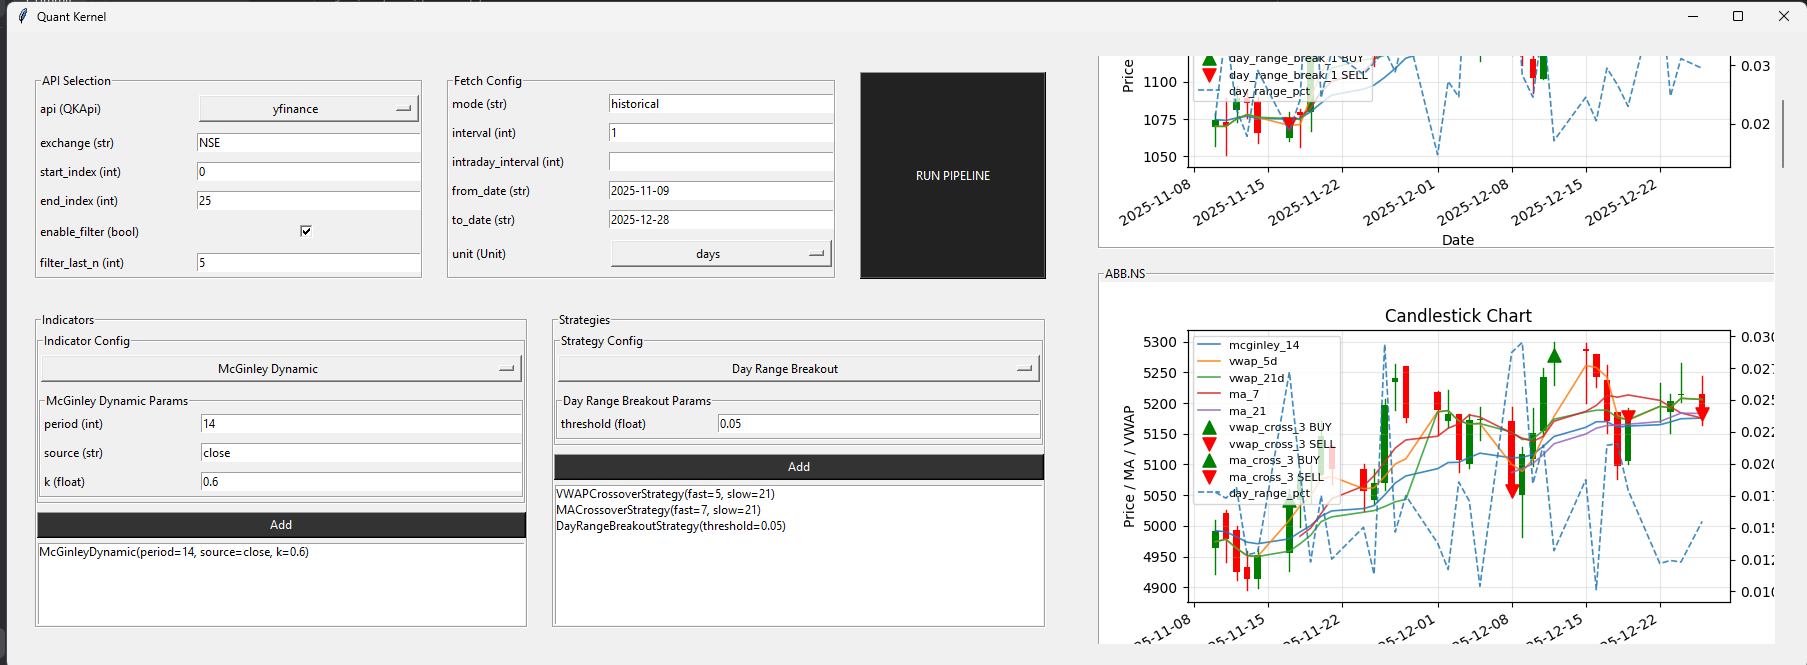
This is a scrollable multi-chart renderer.
- One ticker → one chart → one Matplotlib figure
- Charts are stacked vertically
- Scrollbar appears automatically
- No shared axes between tickers
-
Candlesticks (OHLC)
-
Indicator overlays (MA, VWAP, etc.)
-
Strategy signals:
- ▲ BUY
- ▼ SELL
-
Secondary Y-axis for percentage-based indicators
- Each run clears previous charts
- Charts are destroyed, not hidden
- Prevents figure leaks and memory growth
Run 1: start=0, end=25
Run 2: start=25, end=50
Run 3: start=50, end=75
- Enable filter
- Set
filter_last_n = 3 - Render only actionable tickers
- Add multiple strategies
- Compare signals visually per ticker
- ❌ No automatic trading
- ❌ No hidden state
- ❌ No auto-refresh
- ❌ No implicit caching
Every run is explicit and reproducible.
- UI = configuration
- Controller = orchestration
- DataFrame = truth
- Renderer = visualization only
Once you understand that, everything else clicks.